It was different in a good way - the 2024 nextGEMS+WarmWorld+EERIE Hamburg Hackathon was better than what I had seen before. A very good thing about these projects, such as EERIE, is that they’re open science driven, which makes the life of data-viewer makers a lot easier as colleagues publish data openly and we can monitor what they’re doing.
There were differences between the simulations of the different projects, such as the format and location of the data. However they were easy to access thanks to the Intake catalogues prepared by the technical support team. Technically, the preparation of the hackathon was flawless and this makes all the difference when it comes to being productive. It was great to see the participants talking about science right from the very beginning instead of struggling with technical issues.
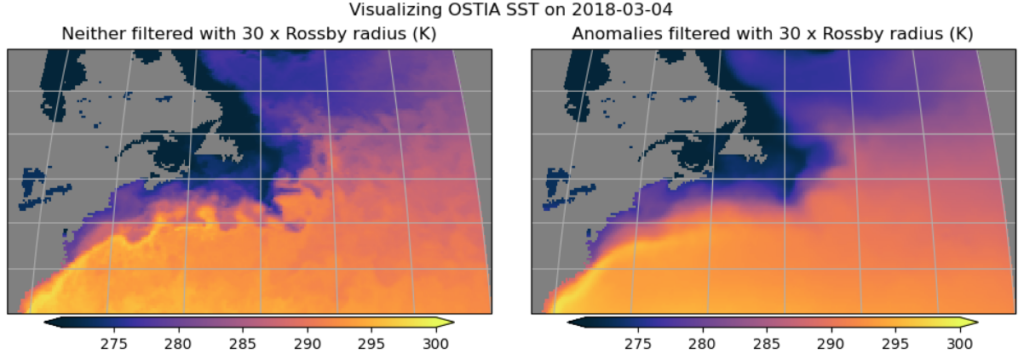
There were several groups sorted not by challenges as I had seen before but rather by topic. The groups were highly dynamic with continuous discussions, instead of participants working on their own. The group I took part in was called Whirls of Wonder and we were working with an eddy-tracking software. In my case, I was checking how climatologies differ between the different AMIP simulations (simulations where the sea surface temperature is prescribed from observations) runs. In some of these runs the eddies were removed in different ways using spatial filters (see the figure below). I continued with a jupyter notebook our former colleague Iuliia Polkova had started during the 2023 EERIE Bremerhaven Hackathon and I could use it thanks to the project’s open data approach. I worked on monthly data to try to speed things up, but I also opened the six-hourly ones for testing the performance, which was great.
I made a simple data viewer where the climatologies of the AMIP simulations from EERIE can be directly compared to the filtered one or choose other variables, by season, zooming in and out, colour palettes… It was just a simple notebook version, but I wanted to show how easy it is to visualise data this way instead of ending up with folders with hundreds of png files.

Figure 2: Simple data viewer Markel built in the hackathon for comparing AMIP simulations.
It was an overall fantastic experience and there were some key take-home messages for me, working on the project’s Data Viewer and aspects to be considered: the great interest on event-based studies such as eddies, cyclones, with a set impacts, trajectory and duration, as well as monsoon, clouds and high-frequency precipitation patterns. The AMOC and heat fluxes are capital too, of course. In this phase of the projects there is a lot of interest in visualising and comparing long term averages, instead of climate change “deltas” (average differences between historical and future projections). The focus is now on optimising how the models reproduce the historical (observed) climate and understanding the impact of eddies. Of course this will change in the late phase of the EERIE project when all the data will be available.
Needless to say not everything was perfect, as the venue was a bit overwhelmed by the large number of participants at the beginning. But that was pretty much all the downsides I could see in the event.
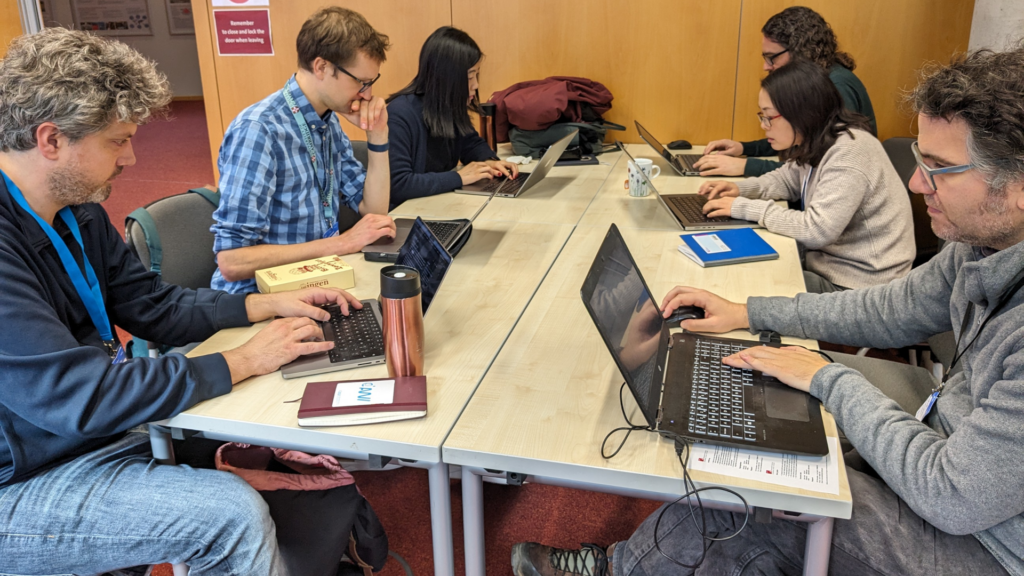
And in case you want to see pictures of the Hamburg hackathon, here’s a photo gallery.