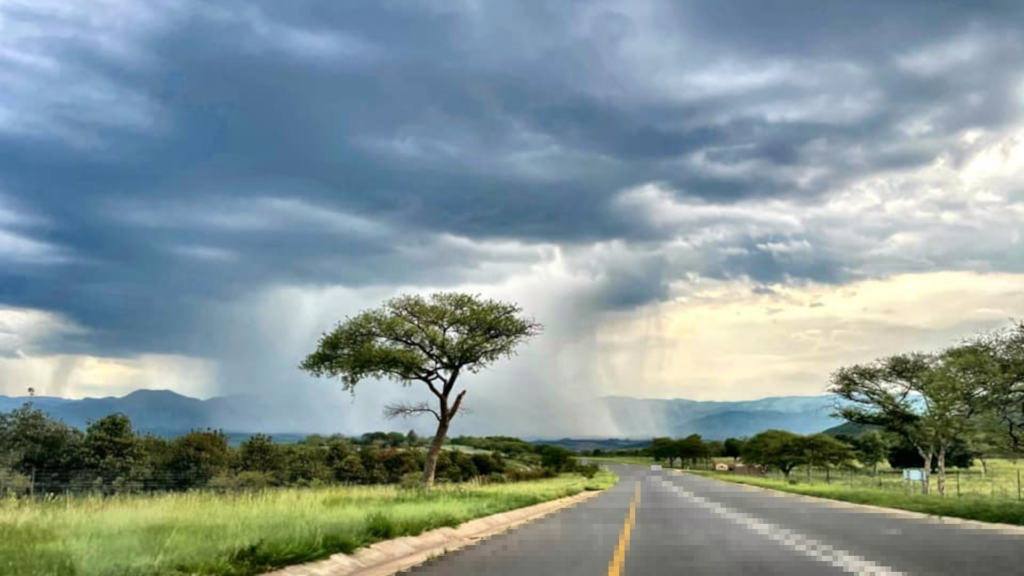
Convective storms - they can be extreme, sudden, and at times, unpredictable, leaving a path of destruction behind. The flashes of lightning, pelting hail, strong winds, even tornadoes and flash flooding are what we associate with storms. But that is not the only reason why we want to better understand such systems. It is often forgotten that convective storms occur in almost every region of the world (except for the polar regions) and are key to the planet's water cycle. Representing these storms and the precipitation they produce in climate models continues to be one of the big challenges for the climate modelling community. And this is particularly true when models are run at a low resolution, meaning these types of storms are often not represented. But why is this the case? It is all about the scale and complexity at which processes that result in a convective storm developing take place.
Precipitation can be generated by large-scale, typically frontal processes, and by convection which occurs at much smaller scales. And it is the simulation of convection that remains a challenge for the climate models. This is because of the complexity of convection, where multiple processes can occur at scales much smaller than at the model’s grid cell (low resolution model grid can easily be greater than 100 km, while a single storm can be less than 25 km in diameter). This means that convection processes need to be parameterized, where assumptions have to be made, resulting in systematic errors in the model output. Increasing the resolution of the models to a resolution where deep convective systems are partially resolved (<4km) is now becoming more feasible, particularly on shorter time scales. For longer time scales, such as those needed to understand climate change, it still remains difficult to achieve.
Progress in super-computing has made it possible to run high-resolution models (10-25 km) at time scales similar to that of the Coupled Model Intercomparison Project (CMIP) models. There is evidence to show that the high-resolution global climate model (GCMs) and Earth System Models (ESMs) are able to improve the representation of the hydrological cycle through producing a more realistic timing and magnitude of features such as the diurnal cycle of precipitation or better representation of extreme rainfall features 1,2. Project EERIE, running an ensemble of models at a resolution ranging between 10-25 km and at climate time scales, aims to improve our understanding of the climate system. This is vital for places like southern Africa, where current climate models have only a modest ability to capture weather systems that drive climate variability and climate extremes across the continent. Part of the University of Cape Town’s role in EERIE is focusing on how well the new model output will help improve our understanding of some of the key rainfall producing systems in southern Africa.
One of the biggest convective storms is the Mesoscale Convective Systems (MCSs). These are defined as large, long-lived, organised convective thunderstorms that are often associated with severe weather events. There are various criteria used to classify a storm as an MCSs, with the most common definition being a long-lived (≥3h) cumulonimbus cloud system that contains a precipitation area extending at least 100 km or more in at least one direction 3. The importance of MCSs is that they play a key role in the hydrological cycle and global circulation through the redistribution of energy, heat and moisture in the atmosphere. In fact, these systems account for a large proportion of precipitation in the tropics as well as the sub-tropics. Compared to many other parts of the world where MCSs are common, like the United States or West Africa, there is relatively little known about these systems in southern Africa.
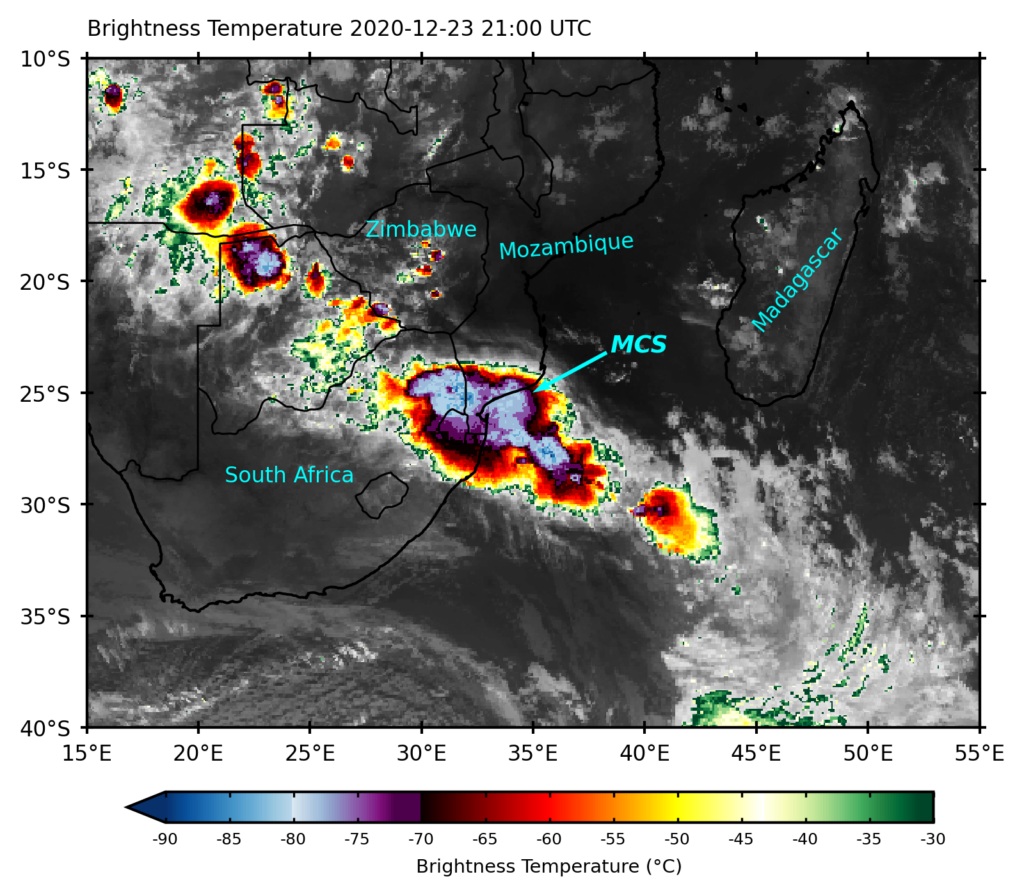
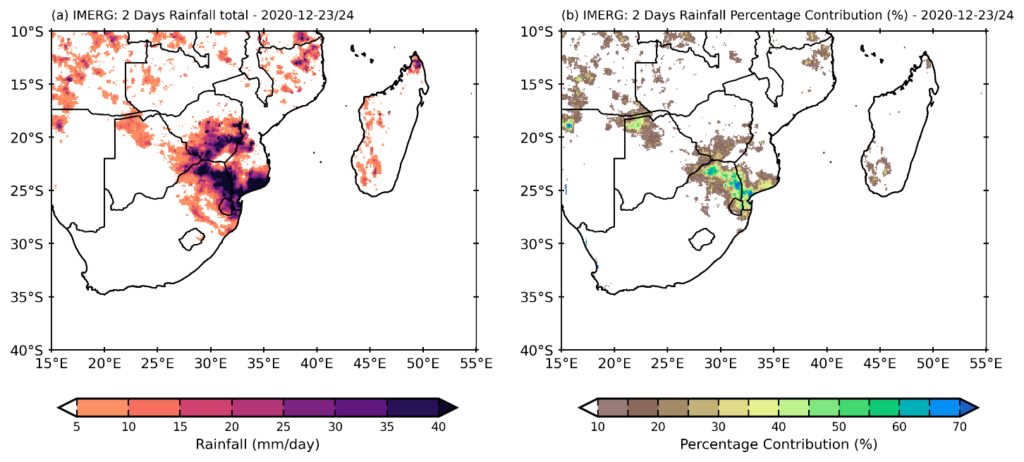
Figure 1 shows an example of an MCS that took place along eastern southern Africa in December 2020. This single event resulted in four casualties due to lightning associated with the storm and considerable damage to infrastructure, destroying houses in the KwaZulu-Natal and Mpumalanga Provinces in South Africa. Precipitation estimated through Integrated Multi-satellite Retrievals for Global Precipitation Measurement Mission (IMERG) indicates that about 40 - 50 mm of rainfall occurred within a few hours due to this system (Fig. 2a). This amount of precipitation recorded equates to more than 40% of the total December 2020 precipitation for some parts of eastern southern Africa from one storm (Fig. 2b).
These types of events are not uncommon, with southeastern regions of southern Africa (and adjacent ocean) having previously been identified as one of the global convective hotspots 4. Research has shown that MCSs frequently occur during austral summer months (November – March) over this region 5,6 and can produce a lot of precipitation when they do occur 7. In fact, one of the largest flooding events in South Africa, the April 2022 flooding in KwaZulu-Natal province, which resulted in over 400 fatalities, is linked to the development of an MCS that interacted with other weather systems 8.
A common feature found in many of the MCS global hotspots is that of a large moisture source to fuel the systems, such as the Gulf of Mexico for systems in the US or Amazon Rainforest for those in South America. Similarly, along the east coast of southern Africa is the warm Mozambique Channel basin and the Agulhas Current (Fig. 3a), one of the strongest western boundary currents 9. Previous research has highlighted how this region acts as a warm pool helping to fuel convective activity 10. However, little is understood how local ocean properties influence MCS development and frequency in the region. Figure 3b reveals that warm sea surface temperature (SST) anomalies were present during the 23 December 2020 MCS event.
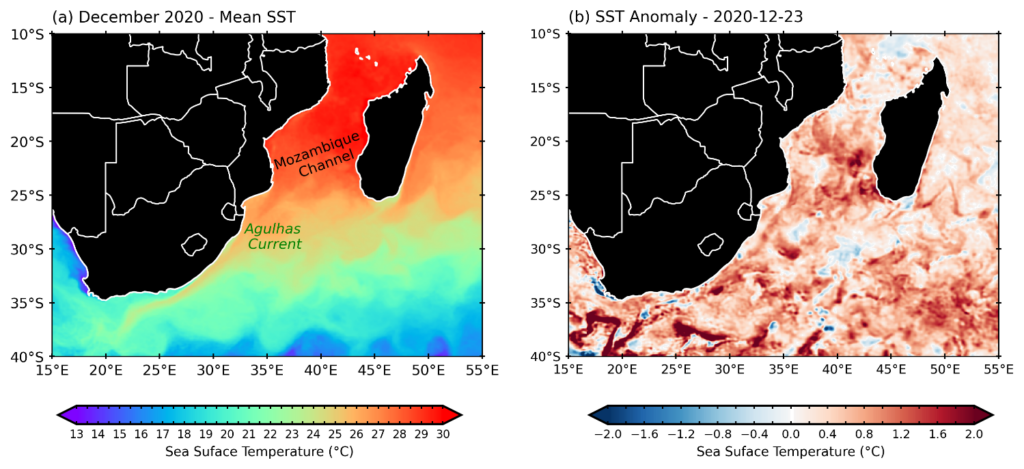
This suggests that more moisture and higher latent heat flux was present during the event, likely increasing the size and intensity of the system. This is where the advantage of Project EERIE lies, in that the high resolution of a new generation of ESMs that better resolve the ocean mesoscale will allow researchers to improve the understanding of MCS interactions with the ocean under a changing climate. In the case here, help in understanding of how local ocean properties within the Mozambique Channel and Agulhas Current System influence the development and frequency of MCSs in southeastern Africa.